[ROOT] ガウス分布を描画するテンプレート
更新日:2022年11月20日(初版作成日:2021年10月17日)

目的
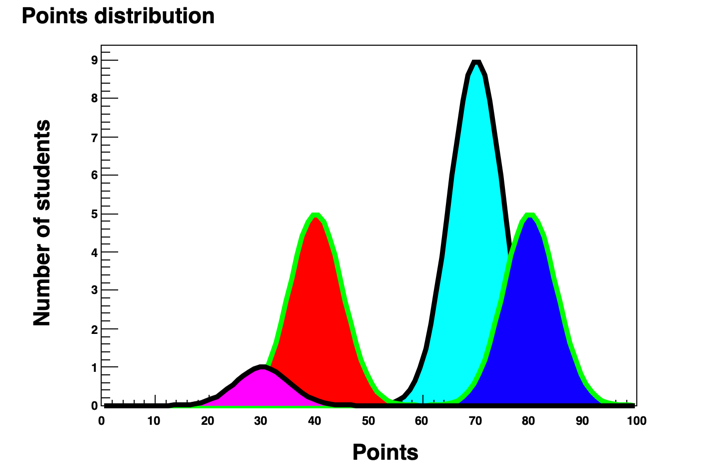
シンプソンのパラドックスになるような分布のグラフを作る。
そのような分布で簡単にイメージできるのは、A高校(共学、緑線)、B高校(工業高校、黒線)の技術授業の成績分布である。
それぞれ、男子、女子の点数分布をガウス分布と仮定する。
一般的に、技術の授業は、男子(青系統の色で示す、女子は赤系統の色)の方が点数が高い。
このような状況では、「B高校の平均点は、A高校よりも高く」なるが、男子、女子別に見ると、「A高校生は、B高校生よりも平均点が高い」となる。
実行
% make
% ./sample
プログラムとMakefile
#include "TApplication.h"
#include "TCanvas.h"
#include "TH1.h"
#include "TF1.h"
#include "TGraph.h"
#include "TLatex.h"
#include "TROOT.h"
#include "TStyle.h"

int main (int argc, char **argv)
{
  using namespace std;
  TApplication app("app", &argc, argv);
  //
  cout << "Drawing graphs." << endl;

  gROOT->SetStyle("Plain");
  gStyle->SetFrameFillColor(0);
  gStyle->SetCanvasColor(0);
  gStyle->SetPaperSize(40, 52);  // for pdf
  gStyle->SetPalette(1);
  //
  //
  //////////////////////////////////////////////////////////////////////////////////////
  // canvas size
  int canvas_y_size = 500;
  double silver_ratio = 1.4142;
  //
  TCanvas *c = new TCanvas("c", "c", 0, 0, (int)(double)canvas_y_size*silver_ratio, canvas_y_size);
  TPad *p = new TPad("p", "p", 0.05, 0.05, 1.0, 1.0);
  p->SetFillStyle(4000);
  p->Draw();
  p->cd();
  //
  //
  TF1 *f1 = new TF1("f1", "gaus", 0, 100);
  f1->SetParameters(9, 70, 5);
  f1->Draw();

  f1->SetTitle("");
  c->Update();
  p->Update();

  TAxis *x_axis = f1->GetXaxis();
  x_axis->SetLabelSize(0.03);
  x_axis->SetLabelOffset(0.02);
  TAxis *y_axis = f1->GetYaxis();
  y_axis->SetLabelSize(0.03);

//
  f1->SetLineWidth(10);
  f1->SetLineColor(1);
  f1->SetFillColor(7);
  f1->SetFillStyle(1001);
  f1->Draw("LF2");
  double int1 = f1->Integral(0, 100);
  cout << int1 << endl;

//
  TF1 *f2 = new TF1("f1", "gaus", 0, 100);
  f2->SetParameters(5, 80, 5);
  f2->SetLineWidth(10);
  f2->SetLineColor(3);
  f2->SetFillColor(4);
  f2->SetFillStyle(1001);
  f2->Draw("LF2same");

  TF1 *f3 = new TF1("f1", "gaus", 0, 100);
  f3->SetParameters(5, 40, 5);
  f3->SetLineWidth(10);
  f3->SetLineColor(3);
  f3->SetFillColor(2);
  f3->SetFillStyle(1001);
  f3->Draw("LF2same");
  double int3 = f3->Integral(0, 100);
  cout << int3 << endl;

  TF1 *f4 = new TF1("f1", "gaus", 0, 100);
  f4->SetParameters(1, 30, 5);
  f4->SetLineWidth(10);
  f4->SetLineColor(1);
  f4->SetFillColor(6);
  f4->SetFillStyle(1001);
  f4->Draw("LF2same");
  double int4 = f4->Integral(0, 100);
  cout << int4 << endl;


  c->cd();
  TLatex *c_title = new TLatex (0.03, 0.95, Form("Points distribution"));
  c_title->Draw();
  //
  TLatex *x_axis_title = new TLatex (0.50, 0.03, Form("Points"));
  x_axis_title->Draw();
  //
  TLatex *y_axis_title = new TLatex (0.07, 0.31, Form("Number of students"));
  y_axis_title->SetTextAngle(90);
  y_axis_title->Draw();

  c->Update();
  p->cd();
  p->Update();
  //
  app.Run();
}
source = sample.cc
object = sample.o
target = sample

CC = g++ -O2
CFLAGS = -Wall

ROOTCONFIG   := root-config
ROOTCFLAGS   := $(shell $(ROOTCONFIG) --cflags)
ROOTLDFLAGS  := $(shell $(ROOTCONFIG) --ldflags)
ROOTLIBS     := $(shell $(ROOTCONFIG) --libs)
ROOTGLIBS    := $(shell $(ROOTCONFIG) --glibs)

ALLROOTLIBS =  $(ROOTLIBS) $(ROOTGLIBS) $(HASTHREAD)
ALLROOTFLAGS = $(ROOTCFLAGS) $(ROOTLDFLAGS)

$target : $(object)
	$(CC) -o $(target) $(ALLROOTLIBS) -lRooFit -lRooFitCore -lFoam -lMinuit -lGui $(object)

$(object): $(source)
	$(CC) -c $(CFLAGS) $(ALLROOTFLAGS) $(source)

.PHONY: clean
clean:
	rm $(target) $(object)
プログラムの備考
TF1 *f1 = new TF1("f1", "gaus", 0, 100);
  f1->SetParameters(9, 70, 5);
  ...
  f1->SetLineWidth(10);
  f1->SetLineColor(1);
  f1->SetFillColor(7);
  f1->SetFillStyle(1001);
  f1->Draw("LF2");
  double int1 = f1->Integral(0, 100);
上記は、ガウス分布を描画する部分を引き抜いたもの。
一行目がガウス分布をx座標0から100の間で描画する、という宣言。
二行目は、そのガウス分布で使用するパラメータ、順にp0、p1、p2で、以下の定義。
\begin{align}
\large p_0 e^{-\frac{1}{2}(\dfrac{x - p_1}{p_2})^2} \tag{1}
\end{align}
あとは、グラフのデコレーション。
順に線の長さ、色、塗りつぶしの色、スタイル。
LF2はline colorとfill color。詳しくは、以下のリンクを参照。
参考
改訂履歴
2022年11月20日:参考にROOTを追加、体裁調整
2022年10月25日:体裁調整
通し番号:11(管理用)


 Total views : 14286