[ROOT] 三次元グラフを描くTips
更新日:2022年11月20日(初版作成日:2021年11月15日)

三次元グラフの描画
ROOTでは、TGraph2DもしくはTH2Dを使用すると、三次元グラフを描画できる。
しかし、データによって、少し注意が必要になる。
本記事では、それぞれのサンプル、注意点を紹介する。
サンプル三次元データ
まず、次のようなデータを使用する。
x 0.1
y 0.001
z 2.77643
x 0.1
y 0.002
z 2.76138
x 0.1
y 0.003
z 2.75712
x 0.2
y 0.001
z 2.78065
x 0.2
y 0.002
z 2.76376
x 0.2
y 0.003
z 2.75256
x 0.3
y 0.001
z 2.76777
x 0.3
y 0.002
z 2.74981
x 0.3
y 0.003
z 2.73483
x 0.4
y 0.001
z 2.80185
x 0.4
y 0.002
z 2.7848
x 0.4
y 0.003
z 2.76798
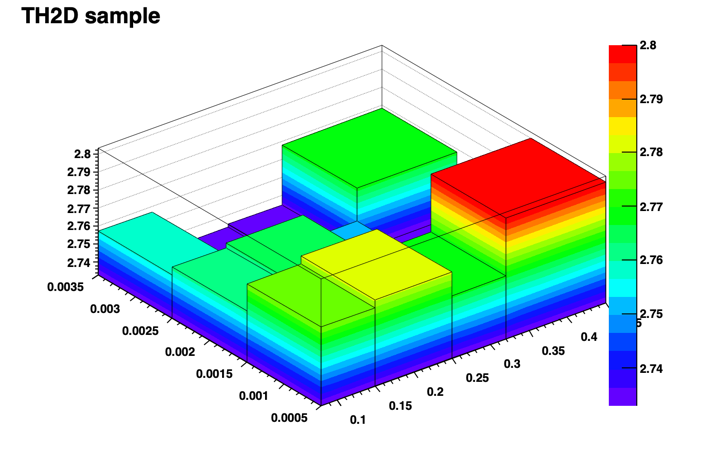
これは、下図のような、右手前に大きな山があって、奥方向(y方向)に下がり、真ん中(xの中間)に谷があるようなデータである。

三次元データ描画
TGraph2Dは、それらしい領域を生成する。
TH2Dは、自前でデータ区切りを生成する。
以下、前半がTGraph2Dによる描画、後半がTH2Dによる描画である。
#include <iostream>
#include <fstream>
#include "TApplication.h"
#include "TCanvas.h"
#include "TH2D.h"
#include "TPaletteAxis.h"
#include "TGraph2D.h"
#include "TLatex.h"
#include "TROOT.h"
#include "TStyle.h"

int main (int argc, char **argv)
{
  using namespace std;
  TApplication app("app", &argc, argv);
  //
  ifstream fin;
  fin.open (app.Argv(1));
  if (fin.fail()){
    cout << "No data file" << endl;
    exit(-1);
  }
  //
  char x_char[3];
  char y_char[3];
  char z_char[3];
  //
  int number_of_x = 4;
  int number_of_y = 3;
  int data_size = number_of_x * number_of_y;
  int read_data_size = 0;
  //
  double x;
  double y;
  double z;
  //
  double x_array[data_size];
  double y_array[data_size];
  double z_array[data_size];
  //
  cout << "Reading data file..." << endl;
  //

  // This depdends on the data format.
  fin >> x_char >> x;
  fin >> y_char >> y;
  fin >> z_char >> z;
  //
  for (int i=0;i<data_size;i++) { // "<=" is for cheking data size
    if (fin.eof()) {
      cout << "Last data was read. Not completed data." << endl;
      cout << i << endl;
      read_data_size = i;
      break;
    }
    //
    cout << x_char << " " << x << endl;
    cout << y_char << " " << y << endl;
    cout << z_char << " " << z << endl;
    //
    if (strcmp(x_char, "x")) {
      cout << "x data error!" << endl; exit(-1);
    }
    if (strcmp(y_char, "y")) {
      cout << "y data error!" << endl; exit(-1);
    }
    if (strcmp(z_char, "z")) {
      cout << "z data error!" << endl; exit(-1);
    }

    x_array[i] = x;
    y_array[i] = y;
    z_array[i] = z;
    cout << i+1 << " data stored." << endl;
    read_data_size = i+1;

    // This depdends on the data format.
    fin >> x_char >> x;
    fin >> y_char >> y;
    fin >> z_char >> z;
  }

  cout << "Drawing graphs." << endl;

  gROOT->SetStyle("Plain");
  gStyle->SetFrameFillColor(0);
  gStyle->SetCanvasColor(0);
  gStyle->SetOptStat(0);
  gStyle->SetPaperSize(40, 52);
  gStyle->SetPalette(1);
  //
  //
  //////////////////////////////////////////////////////////////////////////////////////
  // canvas size
  int canvas_y_size = 500;
  double silver_ratio = 1.4142;
  //
  TCanvas *c = new TCanvas("c", "c", 0, 0, (int)(double)canvas_y_size*silver_ratio, canvas_y_size);
  TPad *p = new TPad("p", "p", 0.05, 0.05, 0.95, 1.0);
  p->SetFillStyle(4000);
  p->Draw();
  p->cd();
  //

  TGraph2D *g1 = new TGraph2D();
  int n = 0;
  while(n < read_data_size){
    g1->SetPoint(n, x_array[n], y_array[n], z_array[n]);
    n++;
  }

  g1->SetTitle("");
  g1->SetNpx(10);
  g1->SetNpy(10);
  g1->Draw("COLZ"); // COLS, surf1 and surf3
  //  g1->Draw("LEGO2Z");

  c->Update();
  p->Update();

  TAxis *x_axis = g1->GetHistogram("empty")->GetXaxis();
  x_axis->SetLabelSize(0.03);
  x_axis->SetLabelOffset(0.02);
  TAxis *y_axis = g1->GetHistogram("empty")->GetYaxis();
  y_axis->SetLabelSize(0.03);
  TPaletteAxis *pal = (TPaletteAxis *)g1->GetHistogram("empty")->GetListOfFunctions()->FindObject("palette");
  pal->GetAxis()->SetLabelSize(0.03);

  g1->Draw("COLZ");
  //  g1->Draw("LEGO2Z");
  //  g1->Draw("surf1");
  //  g1->Draw("surf3");

  c->cd();
  TLatex *c_title = new TLatex (0.03, 0.95, Form("TGraph2D sample"));
  c_title->Draw();
  //
  //
  TLatex *x_axis_title = new TLatex (0.50, 0.03, Form("X title"));
  x_axis_title->Draw();
  //
  TLatex *y_axis_title = new TLatex (0.05, 0.51, Form("Y title"));
  y_axis_title->SetTextAngle(90);
  y_axis_title->Draw();
  //
  TLatex *z_axis_title = new TLatex (0.99, 0.51, Form("Z title"));
  z_axis_title->SetTextAngle(90);
  z_axis_title->Draw();

  ///////////////////////////////////////////////////////////////////////////////////////
  TCanvas *c2 = new TCanvas("c2", "c2", 0, 0, (int)(double)canvas_y_size*silver_ratio, canvas_y_size);
  TPad *p2 = new TPad("p2", "p2", 0.05, 0.05, 0.95, 1.0);
  p2->SetFillStyle(4000);
  p2->Draw();
  p2->cd();
  //
  // You should make your own boxes.
  double x_axis_array[5] = {0.08, 0.15, 0.25, 0.32, 0.45};
  double y_axis_array[4] = {0.0005, 0.0015, 0.0025, 0.0035};
  TH2D *h = new TH2D ("h", "", number_of_x, x_axis_array, number_of_y, y_axis_array);

  for (int i=1;i<=number_of_x;i++){
    for (int j=1;j<=number_of_y;j++) {
      for (int m=0;m< read_data_size;m++){
        if (
          (x_axis_array[i-1] < x_array[m] && x_array[m] < x_axis_array[i]) &&
          (y_axis_array[j-1] < y_array[m] && y_array[m] < y_axis_array[j])
        ) {
          h->SetBinContent(i, j, z_array[m]);
          break;
        }
      }
    }
  }
  h->GetXaxis()->SetLabelSize(0.03);
  h->GetXaxis()->SetLabelOffset(0.02);
  h->GetYaxis()->SetLabelSize(0.03);
  h->GetZaxis()->SetLabelSize(0.03);
  h->SetMaximum(2.8);
  h->SetMinimum(2.733);
  h->Draw("COLZ");
  //  h->Draw("LEGO2Z");
  //  h->Draw("surf1");
  //  h->Draw("surf3");

  c2->cd();
  TLatex *c2_title = new TLatex (0.03, 0.95, Form("TH2D sample"));
  c2_title->Draw();
  //
  TLatex *x_axis_title2 = new TLatex (0.50, 0.03, Form("X title"));
  x_axis_title2->Draw();
  //
  TLatex *y_axis_title2 = new TLatex (0.05, 0.51, Form("Y title"));
  y_axis_title2->SetTextAngle(90);
  y_axis_title2->Draw();
  //
  TLatex *z_axis_title2 = new TLatex (0.99, 0.51, Form("Z title"));
  z_axis_title2->SetTextAngle(90);
  z_axis_title2->Draw();
  //
  p2->Draw();
  //
  app.Run();
}
Makefile
注意)コピペの場合、18、21、25行目の先頭はタブ
source = sample.cc
object = sample.o
target = sample

CC = g++ -O2
CFLAGS = -Wall

ROOTCONFIG   := root-config
ROOTCFLAGS   := $(shell $(ROOTCONFIG) --cflags)
ROOTLDFLAGS  := $(shell $(ROOTCONFIG) --ldflags)
ROOTLIBS     := $(shell $(ROOTCONFIG) --libs)
ROOTGLIBS    := $(shell $(ROOTCONFIG) --glibs)

ALLROOTLIBS =  $(ROOTLIBS) $(ROOTGLIBS) $(HASTHREAD)
ALLROOTFLAGS = $(ROOTCFLAGS) $(ROOTLDFLAGS)

$target : $(object)
	$(CC) -o $(target) $(ALLROOTLIBS) -lRooFit -lRooFitCore -lFoam -lMinuit -lGui $(object)

$(object): $(source)
	$(CC) -c $(CFLAGS) $(ALLROOTFLAGS) $(source)

.PHONY: clean
clean:
	rm $(target) $(object)
描画結果
このようなデータ、グラフ作成の場合、TGraph2D、TH2Dで本質的な違いは無い。
(TH2Dの描画でデータが無い領域をつくらないように調整している)


TH2Dで、データが無い領域がある場合
上記データにおいて、上から1番目、左から2番目の領域にあるデータと上から2番目、左から4番目のデータを削除する。
x 0.1
y 0.001
z 2.77643
x 0.1
y 0.002
z 2.76138
x 0.1
y 0.003
z 2.75712
x 0.2
y 0.001
z 2.78065
x 0.2
y 0.002
z 2.76376
x 0.3
y 0.001
z 2.76777
x 0.3
y 0.002
z 2.74981
x 0.3
y 0.003
z 2.73483
x 0.4
y 0.001
z 2.80185
x 0.4
y 0.003
z 2.76798
描画結果
TGraph2Dは、ナチュラルに補完するため、先程のデータほぼ同じになる。
TH2Dは、”データの無し”を検出できる。


注意)legoプロットの場合、”データ無し”は検出できない。
下図のように、最低点の色で描画される。TGraph2Dとは意味の異なるデータになる。

参考
改訂履歴
2022年11月20日:参考追加
2022年10月25日:体裁調整
通し番号:040(管理用)


 Total views : 13330