[CERN ROOT] シンプルなヒストグラムのテンプレート
更新日:2022年11月20日(初版作成日:2020年8月17日)

目的
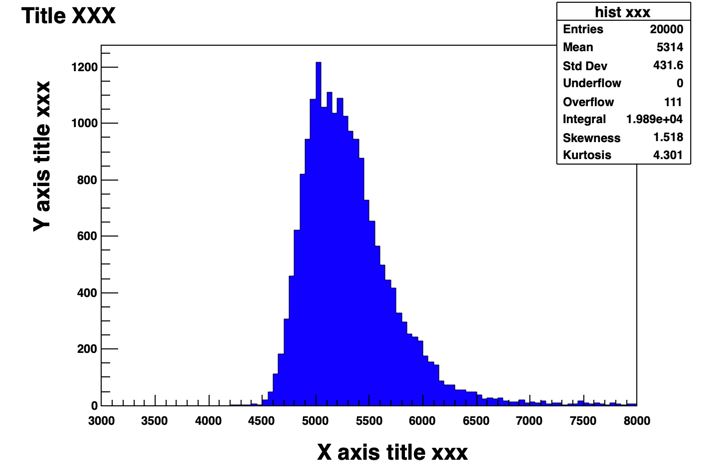
外枠とヒストグラムの枠と軸ラベルを自由に調整できるテンプレートです。
sample.cc、Makefile、sample_data.txtをそのままコピペ+実行でグラフができます。
細かい調整は、ソースコードを参照ください。
実行
% make
% ./sample sample_data.txt
プログラムとMakefile
#include <iostream>
#include <fstream>
#include "TApplication.h"
#include "TCanvas.h"
#include "TH2D.h"
#include "TPaletteAxis.h"
#include "TGraph2D.h"
#include "TLatex.h"
#include "TROOT.h"
#include "TStyle.h"

int main (int argc, char **argv)
{
  using namespace std;
  TApplication app("app", &argc, argv);
  //
  cout << "Reading data file..." << endl;
  //
  ifstream fin;
  fin.open (app.Argv(1));
  if (fin.fail()){
    cout << "No data file" << endl;
    exit(-1);
  }
  //
  int data_size      = 20000;
  int read_data_size = 0;
  //
  double x;
  double x_array[data_size];
  //
  fin >> x; // This is important to use "fin.eof()".
  for (int i=0;i<data_size;i++) {
    if (fin.eof()) {
      cout << "Last data was read. Not completed data." << endl;
      cout << i << endl;
      read_data_size = i;
      break;
    }
    //
    cout << x << endl;
    x_array[i] = x;
    cout << i+1 << " data stored." << endl;
    read_data_size = i+1;

    // This depdends on the data format.
    fin >> x;
  }

  cout << "Drawing graphs." << endl;

  gROOT->SetStyle("Plain");
  gStyle->SetFrameFillColor(0);
  gStyle->SetCanvasColor(0);
  // gStyle->SetOptStat(0);      // without stat info
  gStyle->SetOptStat(111111111); // with stat info (following 9 info (0 means remove))
  // (kurtosis, skewness, bins, overflow, underflow, RMS(SDev), average, number of data, hist name)
  gStyle->SetPaperSize(40, 52);  // for pdf
  gStyle->SetPalette(1);
  //
  //
  //////////////////////////////////////////////////////////////////////////////////////
  // canvas size
  int canvas_y_size = 500;
  double silver_ratio = 1.4142;
  //
  TCanvas *c = new TCanvas("c", "c", 0, 0, (int)(double)canvas_y_size*silver_ratio, canvas_y_size);
  TPad *p = new TPad("p", "p", 0.05, 0.05, 1.0, 1.0);
  p->SetFillStyle(4000);
  p->Draw();
  p->cd();
  //
  //
  TH1I *h1 = new TH1I("hist xxx", "hist xxx", 100, 3000, 8000);
  int n = 0;
  while(n < read_data_size){
    h1->Fill(x_array[n]);
    n++;
  }
  h1->Draw();

  h1->SetTitle("");
  c->Update();
  p->Update();

  TAxis *x_axis = h1->GetXaxis();
  x_axis->SetLabelSize(0.03);
  x_axis->SetLabelOffset(0.02);
  TAxis *y_axis = h1->GetYaxis();
  y_axis->SetLabelSize(0.03);

  h1->SetFillColor(4);
  h1->Draw();

  c->cd();
  TLatex *c_title = new TLatex (0.03, 0.95, Form("Title XXX"));
  c_title->Draw();
  //
  TLatex *x_axis_title = new TLatex (0.45, 0.03, Form("X axis title xxx"));
  x_axis_title->Draw();
  //
  TLatex *y_axis_title = new TLatex (0.07, 0.51, Form("Y axis title xxx"));
  y_axis_title->SetTextAngle(90);
  y_axis_title->Draw();

  c->Update();
  p->cd();
  p->Update();
  //
  app.Run();
}
source = sample.cc
object = sample.o
target = sample

CC = g++ -O2
CFLAGS = -Wall

ROOTCONFIG   := root-config
ROOTCFLAGS   := $(shell $(ROOTCONFIG) --cflags)
ROOTLDFLAGS  := $(shell $(ROOTCONFIG) --ldflags)
ROOTLIBS     := $(shell $(ROOTCONFIG) --libs)
ROOTGLIBS    := $(shell $(ROOTCONFIG) --glibs)

ALLROOTLIBS =  $(ROOTLIBS) $(ROOTGLIBS) $(HASTHREAD)
ALLROOTFLAGS = $(ROOTCFLAGS) $(ROOTLDFLAGS)

$target : $(object)
	$(CC) -o $(target) $(ALLROOTLIBS) -lRooFit -lRooFitCore -lFoam -lMinuit -lGui $(object)

$(object): $(source)
	$(CC) -c $(CFLAGS) $(ALLROOTFLAGS) $(source)

.PHONY: clean
clean:
	rm $(target) $(object)
データファイル
5000付近に散らばる、2万データ。
5261
5036
6096
5200
...
5126
5066
5435
5176
プログラムの備考
データは、数字のテキストデータ。
前半の部分がデータの読込、後半はグラフの描画。
データが足らなくてもグラフを描画。
データは、fin.eof()を読むまで読み込む、fin.eof()の仕様上、一回先読みしている。
白銀比で枠を作成。グラフは、canvasで枠を作成し、padでグラフ部分を作成。
統計情報は、setOptStat()で設定。一桁目から順にトグルスイッチになっているので、必要無い部分は”1″から”0″に変更する。
1桁目から順に
“hist xxx”、ヒストグラムの名前
“Entries”、使用したデータの数
“Mean”、平均
“Std Dev”、標準偏差
“Underflow”、グラフの枠に入り切らない小さすぎるデータ数
“Overflow”、グラフの枠に入り切らない大きすぎるデータ数
“Integral”、枠内の積分値
“Skewness”、歪度(わいど)、歪み具合(正規分布で0)
“Kurtosis”、尖度(せんど)、尖り具合(正規分布で0)
参考資料
改訂履歴
2022年11月20日:参考追加、体裁調整
2022年09月11日:code-prettifyに変更
2022年08月13日:WordPress用に色とタグを変更
2020年08月17日:初版作成
通し番号:010(管理用)


 Total views : 13131